Histogram of the tone mapped image: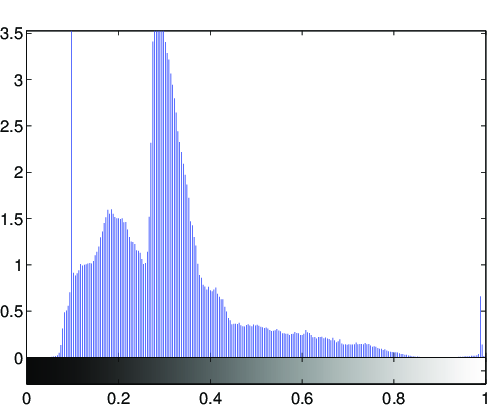
Image statistics of the tone-mapped image:Median percentile of the lightness (CIE L*a*b*): 31.3329Mean of the chroma value (CIE L*a*b*): 5.5905
(evalution of the fit via PSNR: PSNR = 35.9188dB)
Fitted tone curve of the generic tone mapping operator,
compared to the luminance compression done by the tone mapping operator: 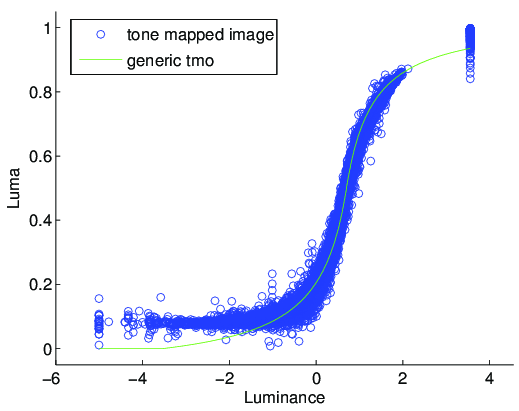
Fitted parameters of the generic tmo:Exposure: 0.70488Contrast: 1.7108Low midtone range: 4.2308High midtone range: 9.7533Saturation: 0.26366Frequencies: 0.716, 0.949, 0.991, 0.999, 0.995