Histogram of the tone mapped image: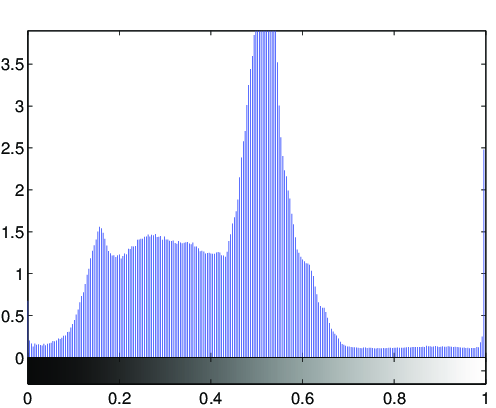
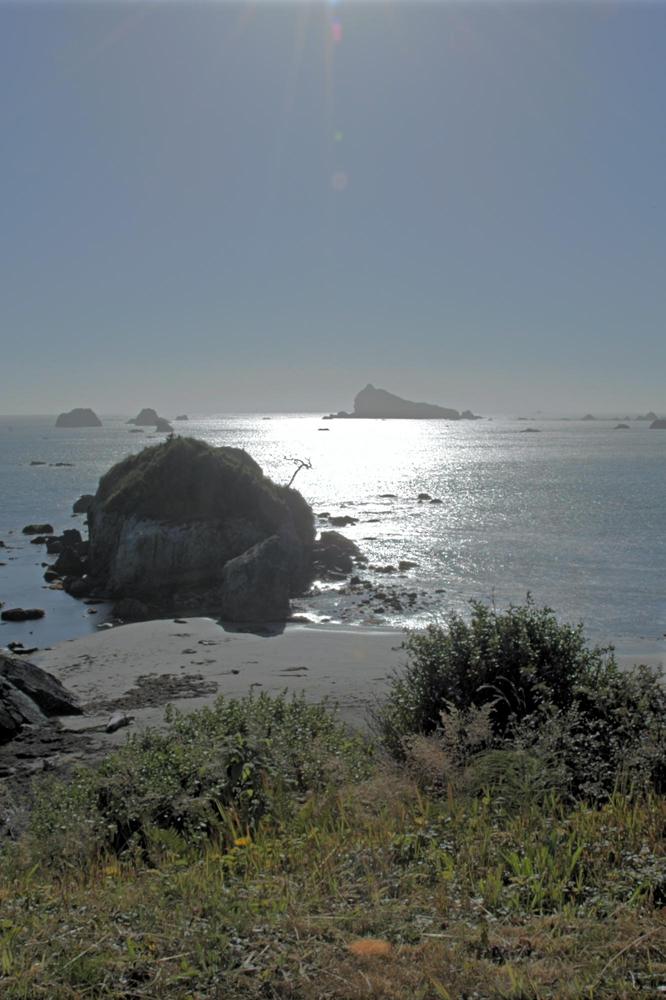
Image statistics of the tone-mapped image:Median percentile of the lightness (CIE L*a*b*): 51.0367Mean of the chroma value (CIE L*a*b*): 10.4671
(evalution of the fit via PSNR: PSNR = 27.5963dB)
Fitted tone curve of the generic tone mapping operator,
compared to the luminance compression done by the tone mapping operator: 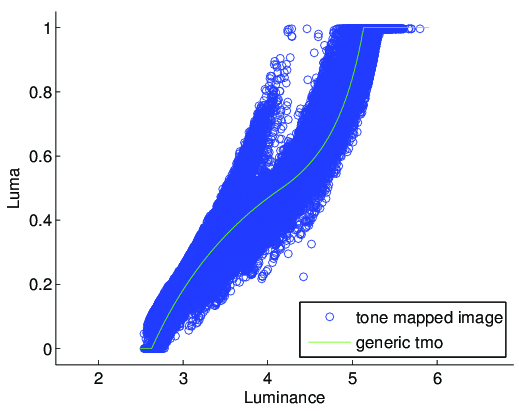
Fitted parameters of the generic tmo:Exposure: 4.1684Contrast: 0.35971Low midtone range: 1.5378High midtone range: 0.95954Saturation: 0.69197Frequencies: 1.351, 1.33, 1.479, 1.438, 1.384