Histogram of the tone mapped image: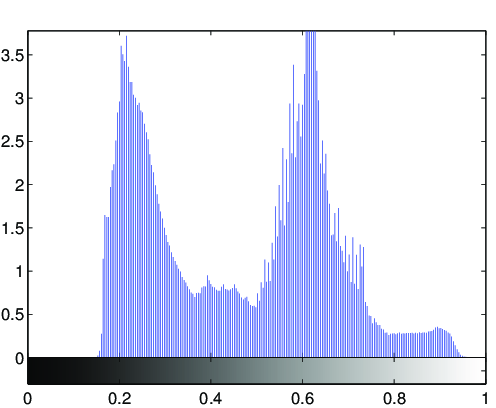
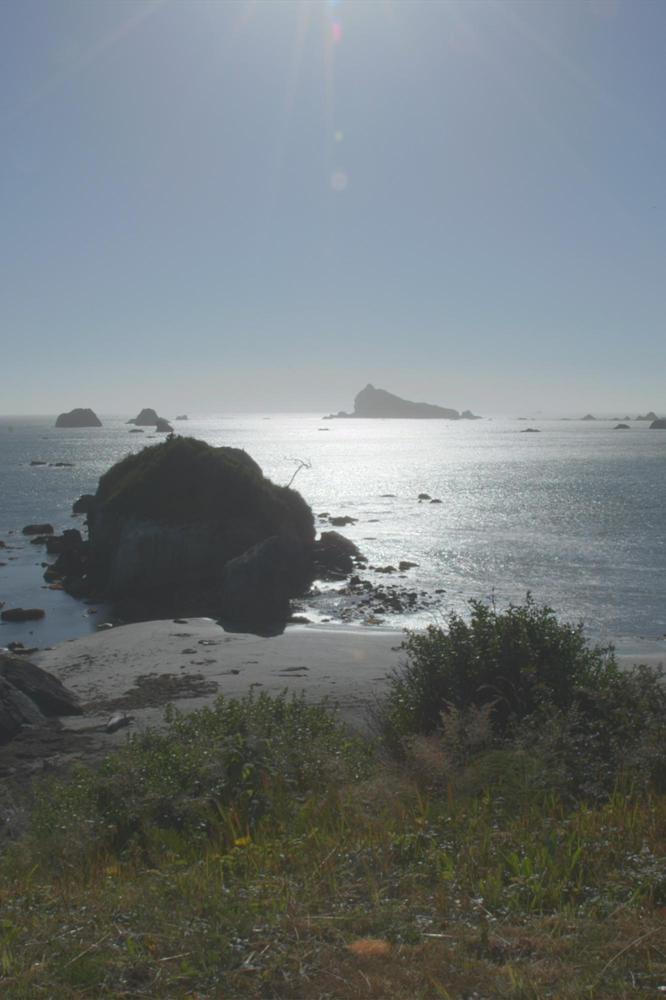
Image statistics of the tone-mapped image:Median percentile of the lightness (CIE L*a*b*): 54.8673Mean of the chroma value (CIE L*a*b*): 8.4711
(evalution of the fit via PSNR: PSNR = 36.9642dB)
Fitted tone curve of the generic tone mapping operator,
compared to the luminance compression done by the tone mapping operator: 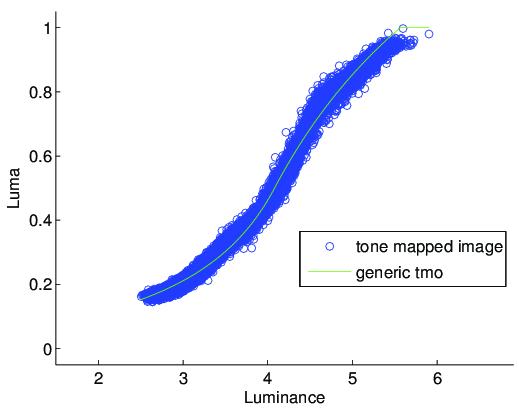
Fitted parameters of the generic tmo:Exposure: 4.0827Contrast: 0.99744Low midtone range: 5.1323High midtone range: 1.4884Saturation: 0.60787Frequencies: -0.101, 0.68, 1.045, 1.051, 1.024