Histogram of the tone mapped image: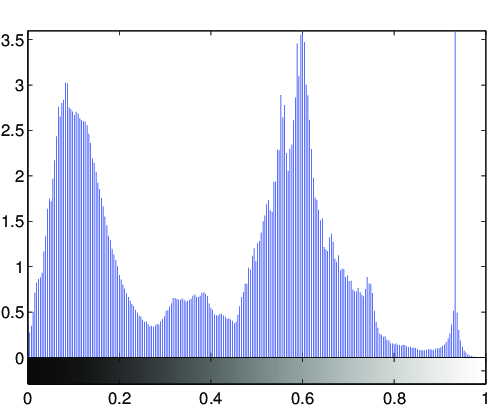
Image statistics of the tone-mapped image:Median percentile of the lightness (CIE L*a*b*): 50.957Mean of the chroma value (CIE L*a*b*): 9.199
(evalution of the fit via PSNR: PSNR = 36.2992dB)
Fitted tone curve of the generic tone mapping operator,
compared to the luminance compression done by the tone mapping operator: 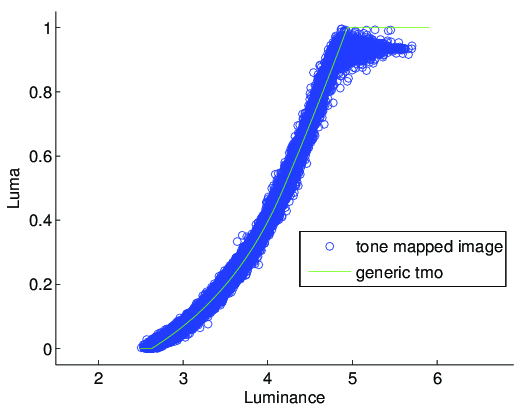
Fitted parameters of the generic tmo:Exposure: 4.189Contrast: 1.2439Low midtone range: 1.5591High midtone range: 0.75333Saturation: 0.82996Frequencies: -0.014, 0.726, 0.986, 0.988, 0.958