
Histogram of the tone mapped image: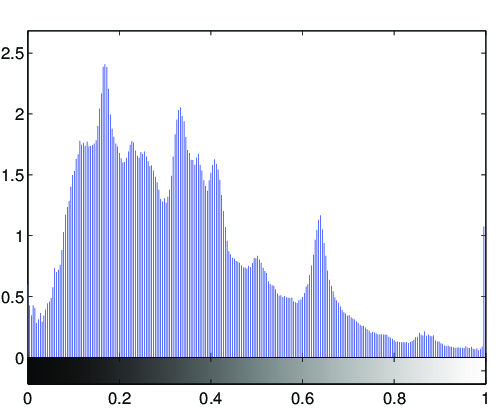
Image statistics of the tone-mapped image:Median percentile of the lightness (CIE L*a*b*): 33.6412Mean of the chroma value (CIE L*a*b*): 9.4817
(evalution of the fit via PSNR: PSNR = 25.0267dB)

Fitted tone curve of the generic tone mapping operator,
compared to the luminance compression done by the tone mapping operator: 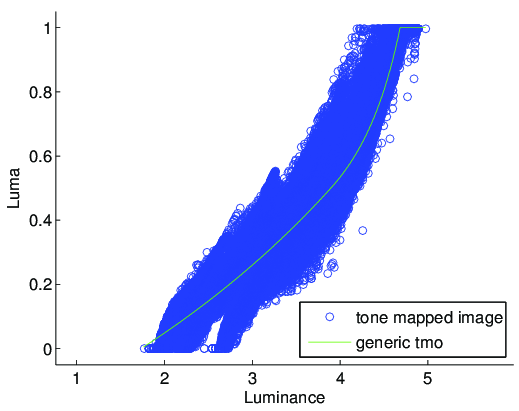
Fitted parameters of the generic tmo:Exposure: 3.8964Contrast: 0.60471Low midtone range: 2.1633High midtone range: 0.78892Saturation: 0.66274Frequencies: 1.002, 1.117, 1.318, 1.336, 1.458