Histogram of the tone mapped image: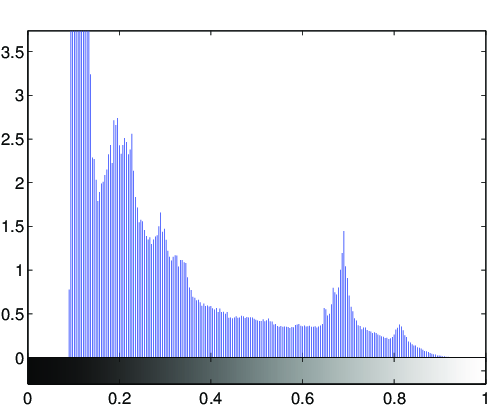
Image statistics of the tone-mapped image:Median percentile of the lightness (CIE L*a*b*): 23.0642Mean of the chroma value (CIE L*a*b*): 4.2444
(evalution of the fit via PSNR: PSNR = 35.2599dB)
Fitted tone curve of the generic tone mapping operator,
compared to the luminance compression done by the tone mapping operator: 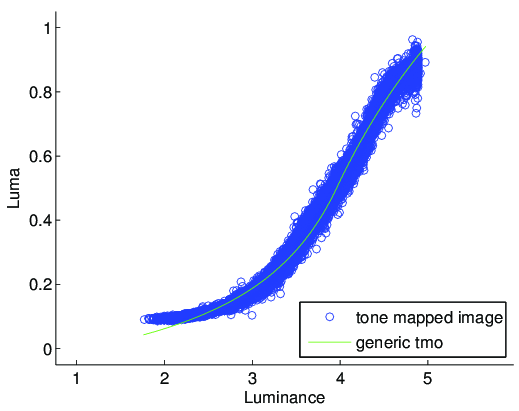
Fitted parameters of the generic tmo:Exposure: 3.9613Contrast: 1.1581Low midtone range: 2.8941High midtone range: 1.2024Saturation: 0.4199Frequencies: 0.04, 0.762, 0.958, 0.972, 1.011