
Histogram of the tone mapped image: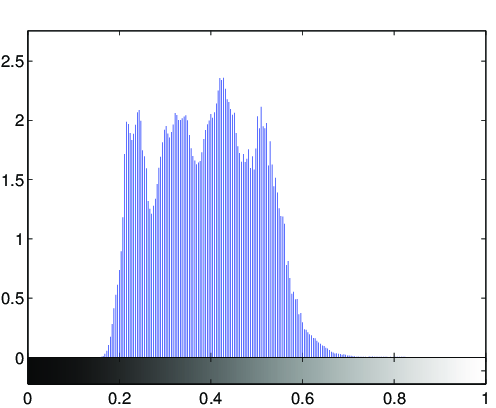
Image statistics of the tone-mapped image:Median percentile of the lightness (CIE L*a*b*): 43.6285Mean of the chroma value (CIE L*a*b*): 36.9336
(evalution of the fit via PSNR: PSNR = 29.7764dB)

Fitted tone curve of the generic tone mapping operator,
compared to the luminance compression done by the tone mapping operator: 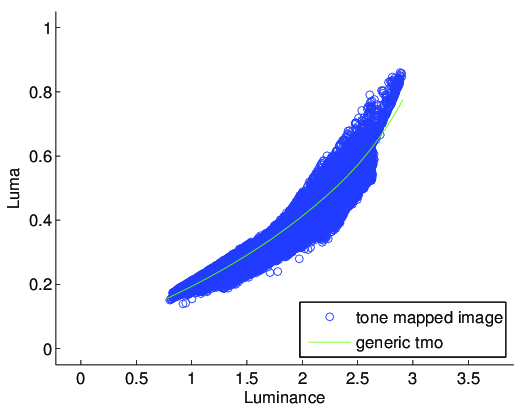
Fitted parameters of the generic tmo:Exposure: 2.2969Contrast: 0.63698Low midtone range: 2.7139High midtone range: 0.90366Saturation: 0.61309Frequencies: 1.588, 1.241, 1.22, 1.225, 1.196