
Histogram of the tone mapped image: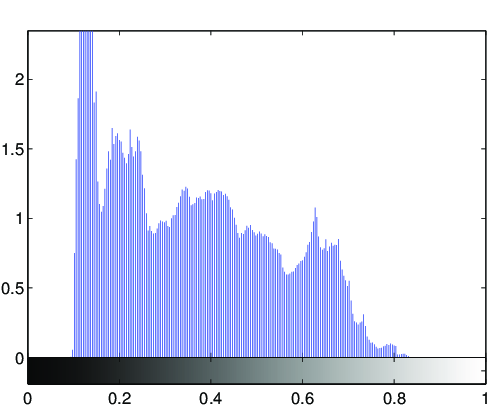
Image statistics of the tone-mapped image:Median percentile of the lightness (CIE L*a*b*): 37.4875Mean of the chroma value (CIE L*a*b*): 26.0706
(evalution of the fit via PSNR: PSNR = 39.2759dB)

Fitted tone curve of the generic tone mapping operator,
compared to the luminance compression done by the tone mapping operator: 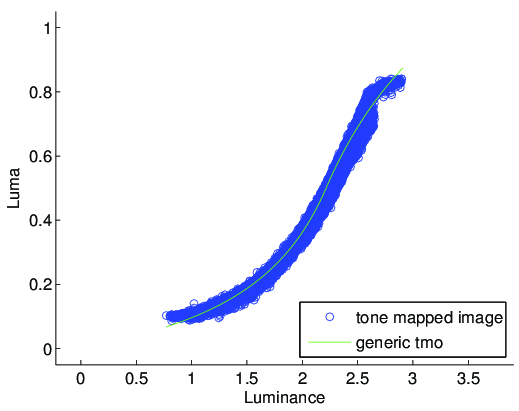
Fitted parameters of the generic tmo:Exposure: 2.2167Contrast: 1.5957Low midtone range: 2.2624High midtone range: 1.1076Saturation: 0.43824Frequencies: -0.004, 0.64, 1.043, 1.02, 1.017