
Histogram of the tone mapped image:
Image statistics of the tone-mapped image:Median percentile of the lightness (CIE L*a*b*): 38.3167Mean of the chroma value (CIE L*a*b*): 37.8302
(evalution of the fit via PSNR: PSNR = 29.817dB)

Fitted tone curve of the generic tone mapping operator,
compared to the luminance compression done by the tone mapping operator: 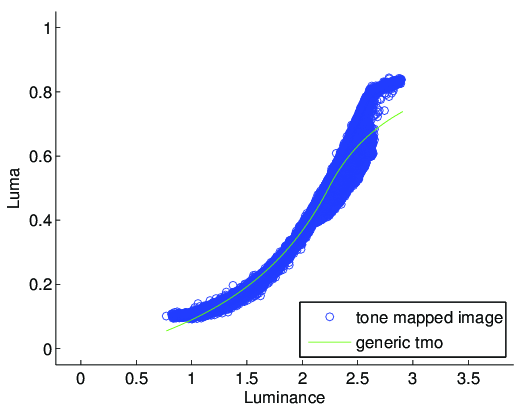
Fitted parameters of the generic tmo:Exposure: 2.2368Contrast: 1.3382Low midtone range: 1.9383High midtone range: 35.1238Saturation: 0.6373Frequencies: -0.013, 0.701, 1.147, 1.08, 1.082