
Histogram of the tone mapped image: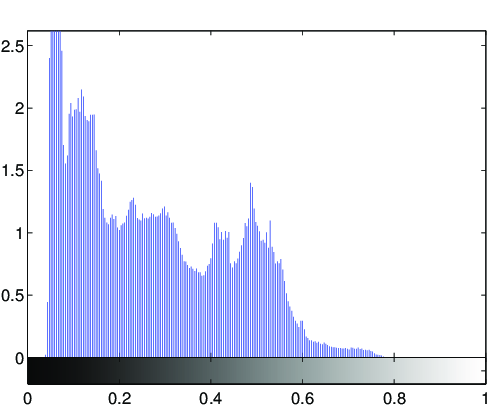
Image statistics of the tone-mapped image:Median percentile of the lightness (CIE L*a*b*): 26.1642Mean of the chroma value (CIE L*a*b*): 36.4716
(evalution of the fit via PSNR: PSNR = 27.5dB)

Fitted tone curve of the generic tone mapping operator,
compared to the luminance compression done by the tone mapping operator: 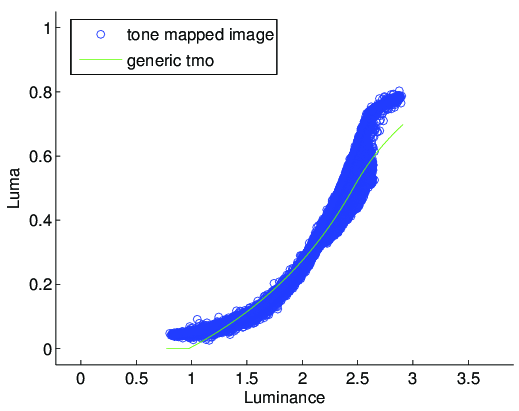
Fitted parameters of the generic tmo:Exposure: 2.4644Contrast: 1.2221Low midtone range: 1.4851High midtone range: 1.6Saturation: 0.8616Frequencies: -0.036, 0.7, 1.32, 1.173, 1.174