
Histogram of the tone mapped image: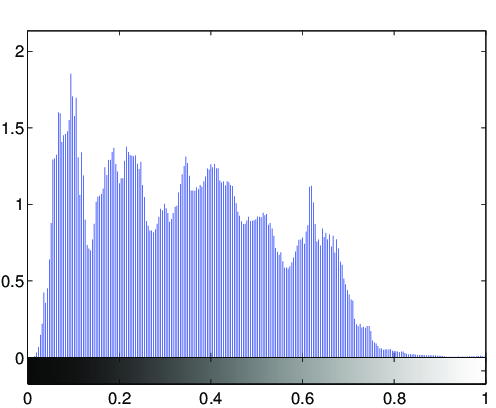
Image statistics of the tone-mapped image:Median percentile of the lightness (CIE L*a*b*): 37.6599Mean of the chroma value (CIE L*a*b*): 27.3288
(evalution of the fit via PSNR: PSNR = 37.0021dB)

Fitted tone curve of the generic tone mapping operator,
compared to the luminance compression done by the tone mapping operator: 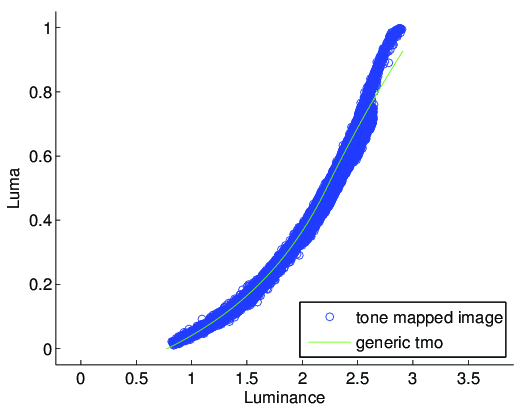
Fitted parameters of the generic tmo:Exposure: 2.2211Contrast: 1.4132Low midtone range: 1.4403High midtone range: 0.8238Saturation: 0.46479Frequencies: 0.012, 0.653, 1.041, 1.031, 1.036