
Histogram of the tone mapped image: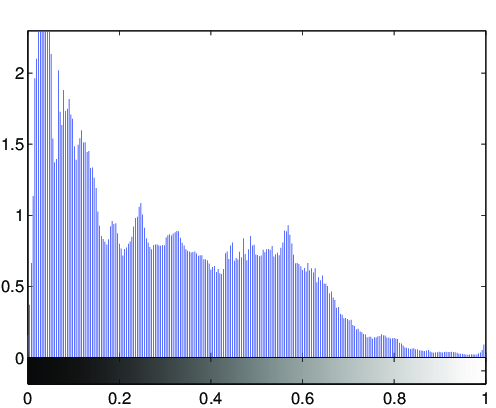
Image statistics of the tone-mapped image:Median percentile of the lightness (CIE L*a*b*): 27.6983Mean of the chroma value (CIE L*a*b*): 34.7324
(evalution of the fit via PSNR: PSNR = 24.954dB)

Fitted tone curve of the generic tone mapping operator,
compared to the luminance compression done by the tone mapping operator: 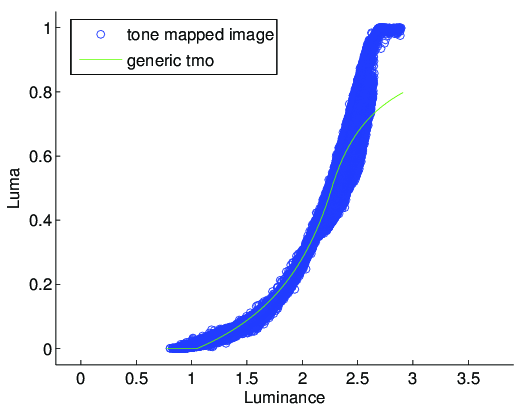
Fitted parameters of the generic tmo:Exposure: 2.2649Contrast: 2.2756Low midtone range: 1.2191High midtone range: 298.0984Saturation: 0.62409Frequencies: -0.064, 0.679, 1.09, 1.068, 1.093