
Histogram of the tone mapped image: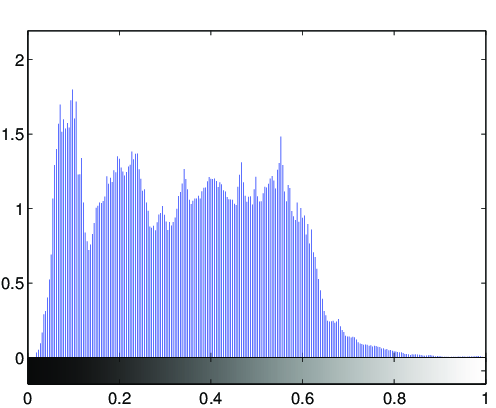
Image statistics of the tone-mapped image:Median percentile of the lightness (CIE L*a*b*): 38.6006Mean of the chroma value (CIE L*a*b*): 39.3635
(evalution of the fit via PSNR: PSNR = 27.8377dB)

Fitted tone curve of the generic tone mapping operator,
compared to the luminance compression done by the tone mapping operator: 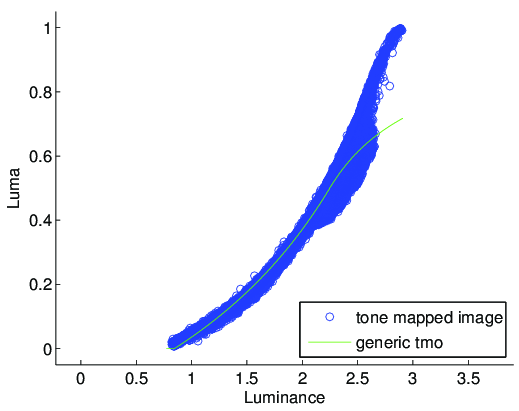
Fitted parameters of the generic tmo:Exposure: 2.2499Contrast: 1.1496Low midtone range: 1.4041High midtone range: 32.2539Saturation: 0.67315Frequencies: 0.014, 0.714, 1.135, 1.097, 1.141