
Histogram of the tone mapped image: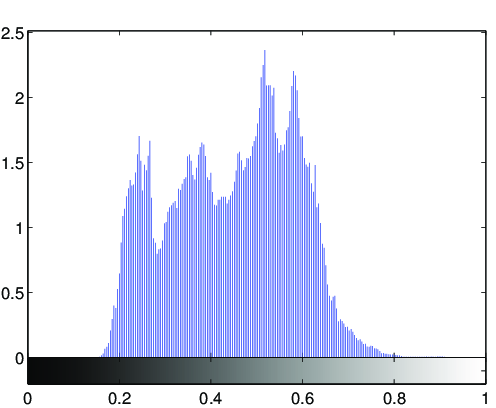
Image statistics of the tone-mapped image:Median percentile of the lightness (CIE L*a*b*): 51.1011Mean of the chroma value (CIE L*a*b*): 43.0386
(evalution of the fit via PSNR: PSNR = 30.3532dB)

Fitted tone curve of the generic tone mapping operator,
compared to the luminance compression done by the tone mapping operator: 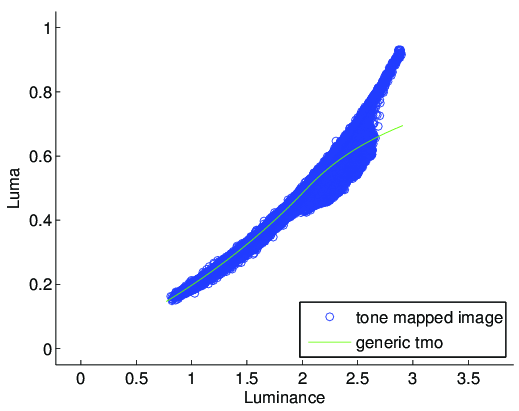
Fitted parameters of the generic tmo:Exposure: 2.0446Contrast: 0.7349Low midtone range: 2.0761High midtone range: 66.5023Saturation: 0.61174Frequencies: 0.082, 0.699, 1.104, 1.087, 1.187