Histogram of the tone mapped image: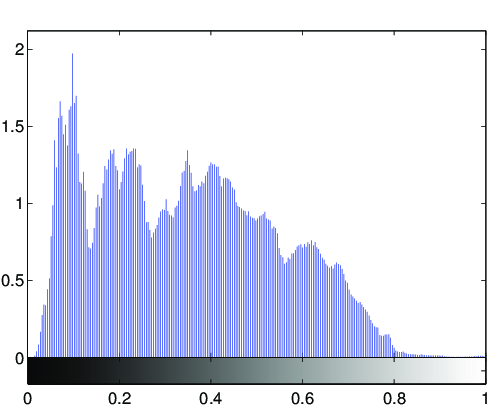
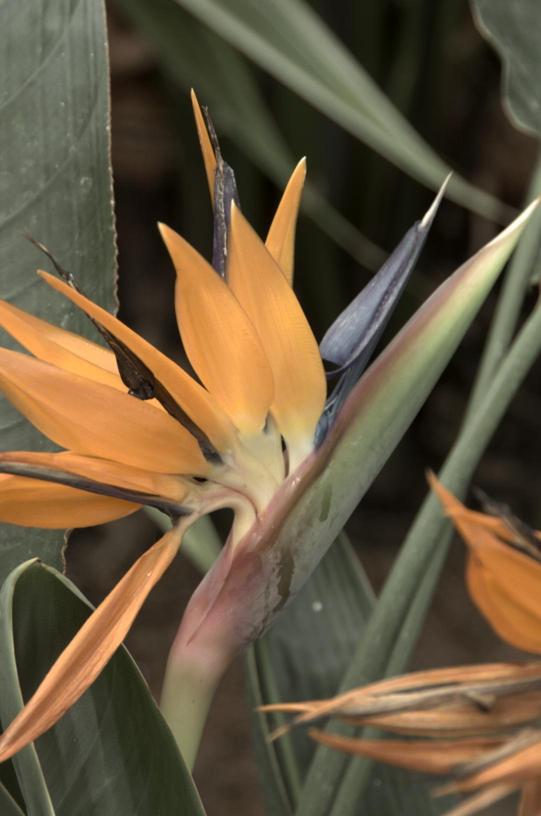
Image statistics of the tone-mapped image:Median percentile of the lightness (CIE L*a*b*): 37.3943Mean of the chroma value (CIE L*a*b*): 18.0414
(evalution of the fit via PSNR: PSNR = 41.0288dB)

Fitted tone curve of the generic tone mapping operator,
compared to the luminance compression done by the tone mapping operator: 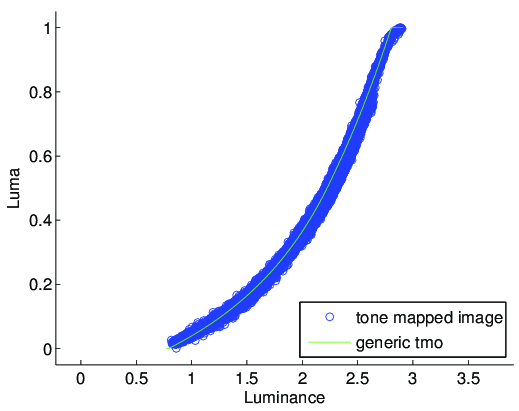
Fitted parameters of the generic tmo:Exposure: 2.2253Contrast: 1.3935Low midtone range: 1.4348High midtone range: 0.58124Saturation: 0.28893Frequencies: -0.001, 0.622, 0.998, 1.007, 0.997