
Histogram of the tone mapped image:
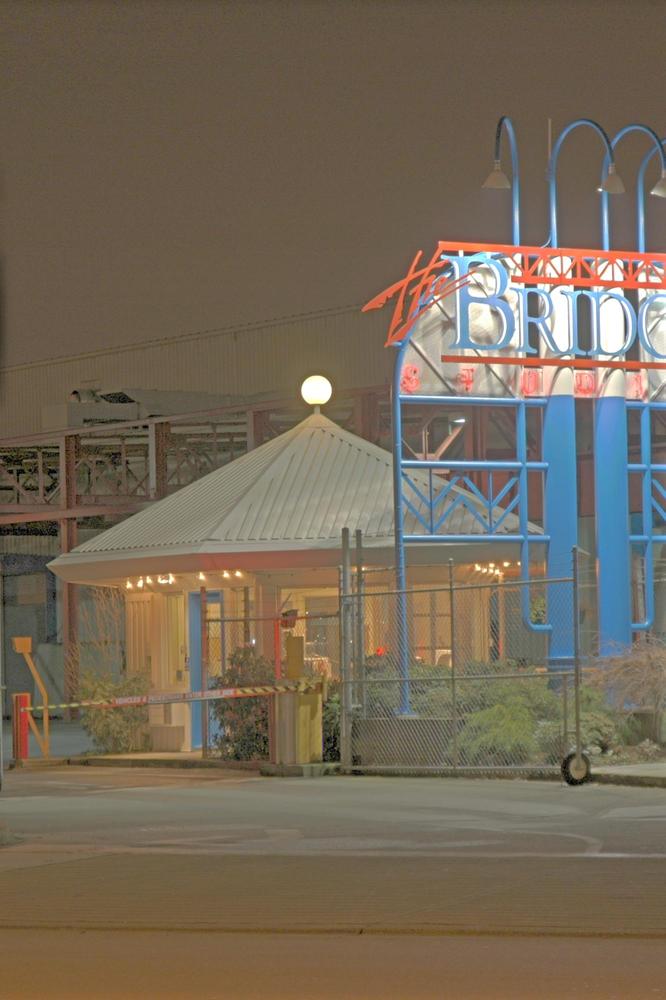
Image statistics of the tone-mapped image:Median percentile of the lightness (CIE L*a*b*): 41.6727Mean of the chroma value (CIE L*a*b*): 15.5067
(evalution of the fit via PSNR: PSNR = 22.1411dB)
Fitted tone curve of the generic tone mapping operator,
compared to the luminance compression done by the tone mapping operator: 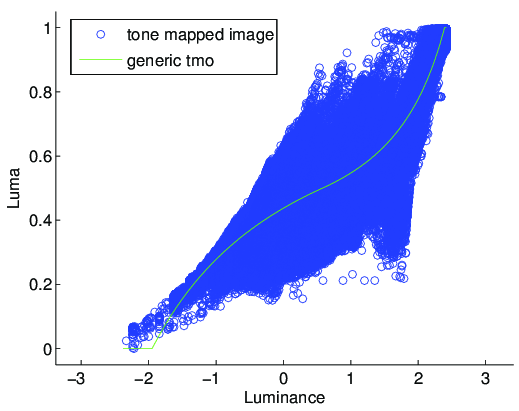
Fitted parameters of the generic tmo:Exposure: 0.58301Contrast: 0.18969Low midtone range: 2.5219High midtone range: 1.8101Saturation: 0.39Frequencies: 1.573, 1.391, 1.738, 1.53, 1.648