Histogram of the tone mapped image: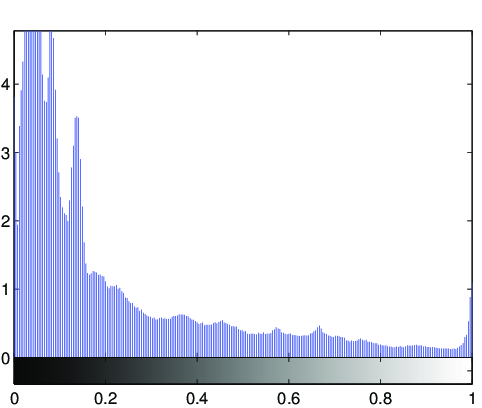
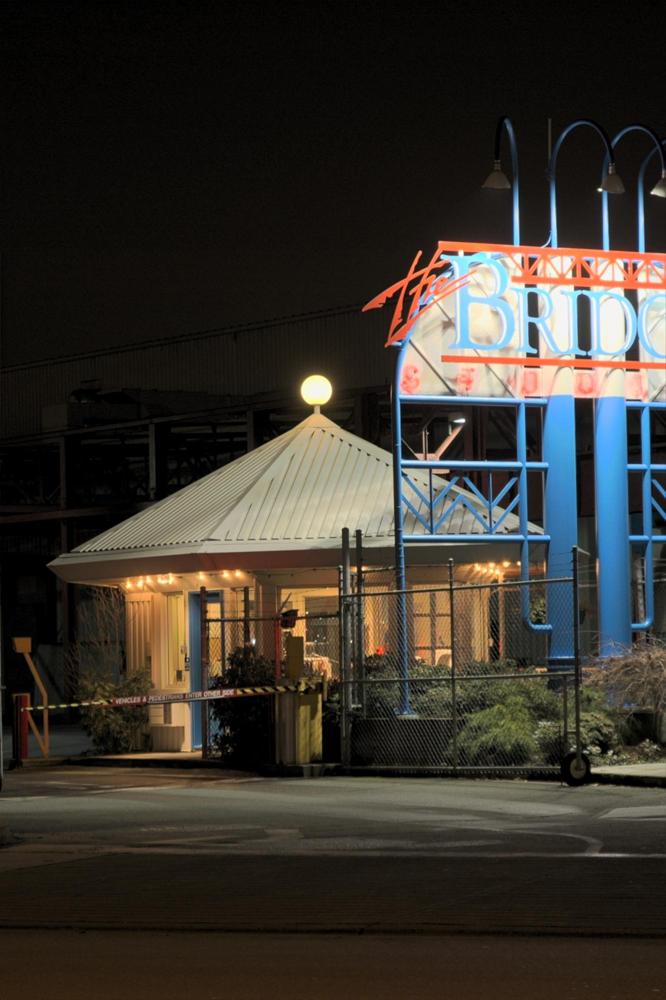
Image statistics of the tone-mapped image:Median percentile of the lightness (CIE L*a*b*): 9.5249Mean of the chroma value (CIE L*a*b*): 14.6055
(evalution of the fit via PSNR: PSNR = 28.505dB)
Fitted tone curve of the generic tone mapping operator,
compared to the luminance compression done by the tone mapping operator: 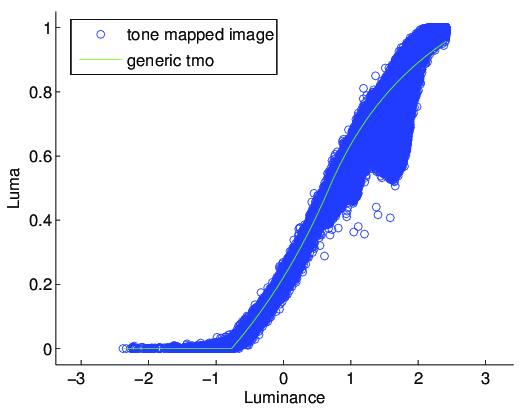
Fitted parameters of the generic tmo:Exposure: 0.68108Contrast: 0.97924Low midtone range: 1.4479High midtone range: 2.0769Saturation: 0.49954Frequencies: -0.177, 0.734, 1.014, 1.033, 1.038