
Road stories
I spent 2011–2016 as the chief data scientist at Urban Engines, a Silicon Valley startup now part of Google. We built a big data platform with specialised capabilities for handling space-time data such as road traffic.
The plots below come from the platform we built for interacting with data. You circle San Francisco and say "select trips that start here", then you circle Palo Alto and say "select trips that end here", then you circle around highways 280 and 101 in turn and say "select trips that go via here". Then tell it "colour-code by via region", and you have your plot. There is plenty of database query construction and data subsampling and so on under the hood, but the user experience is nearly effortless.
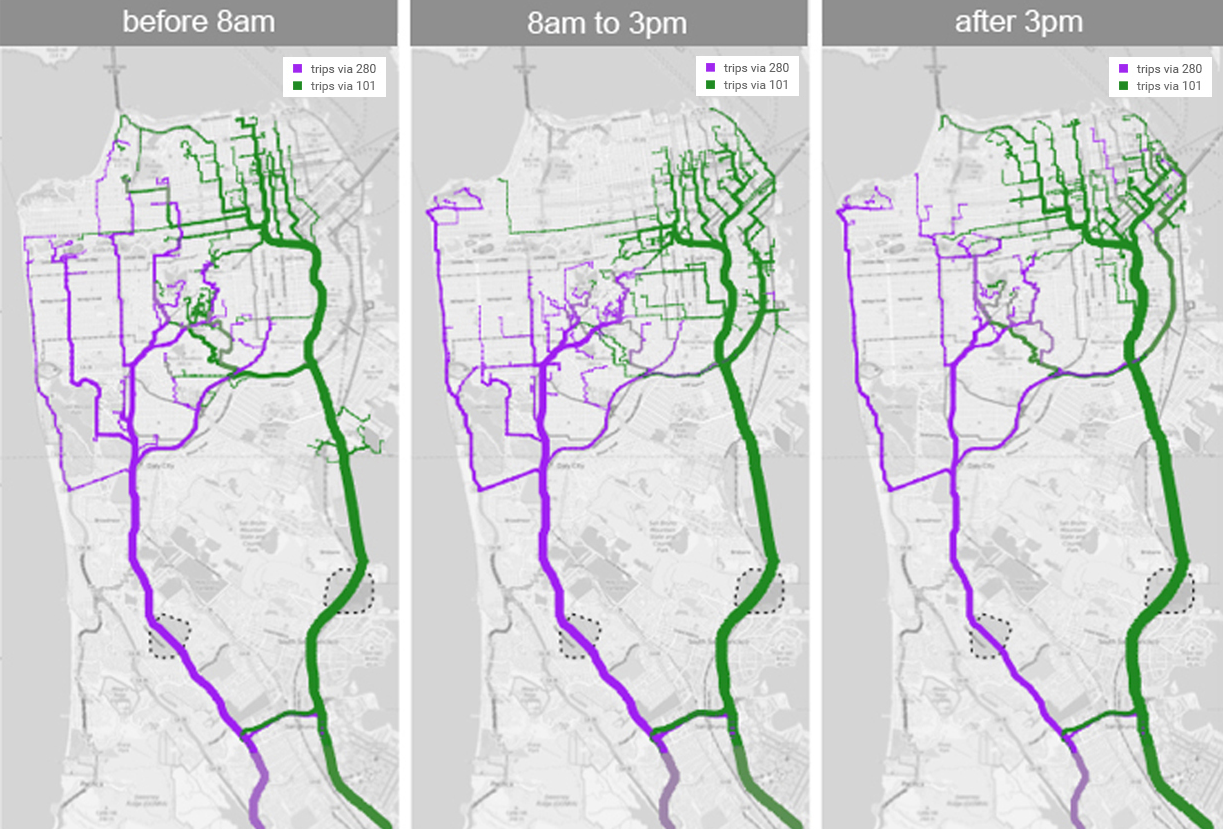
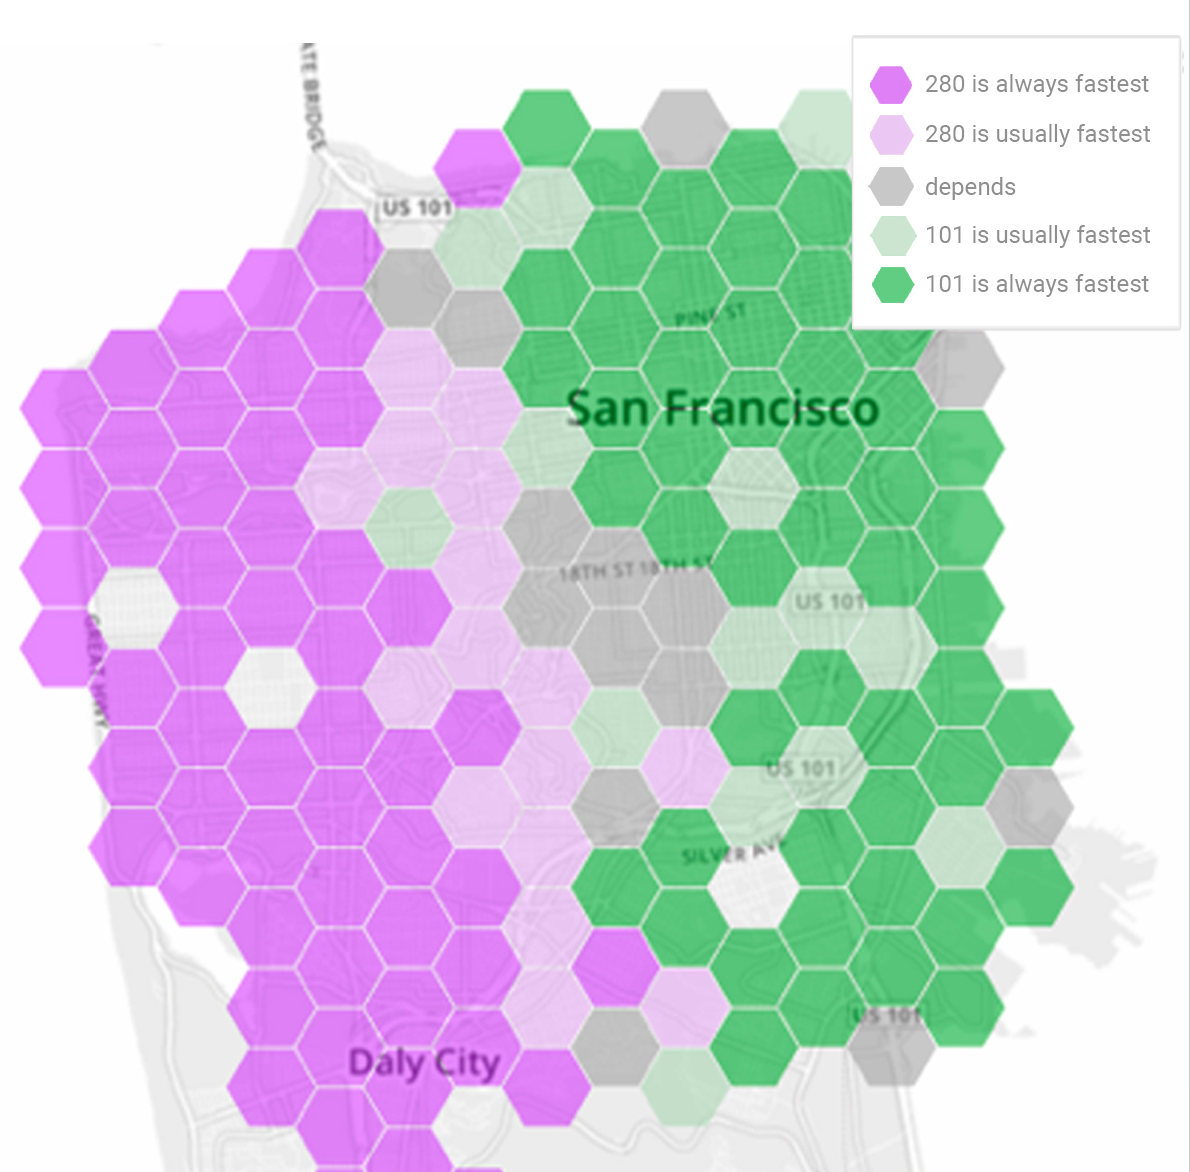
What route should you take from San Francisco to Palo Alto?
Traffic volumes are colour-coded by which route the drivers took, purple for 280 and green for 101. At different times of day, the two routes have different catchment areas. Using historical traffic data we can calculate which route actually turned out to be faster for each driver, and split the city accordingly.Our source data was the Bay Area Travel Survey from the year 2000. Selected households were asked to keep a detailed activity log over two days, detailing everywhere they went, when and why. We scaled up the data to synthesize activities for the entire city, in proportion to 2016 population statistics; and we ran a routing algorithm to select several routes; and found the travel time for each route using both historical averages and instantaneous speeds on each segment of road. This was all implemented in a custom distributed database with a novel query language that combines SQL-style querying and Python-style imperative code. (The data synthesis was to give our database a workout: real data is always better than synthetic!)
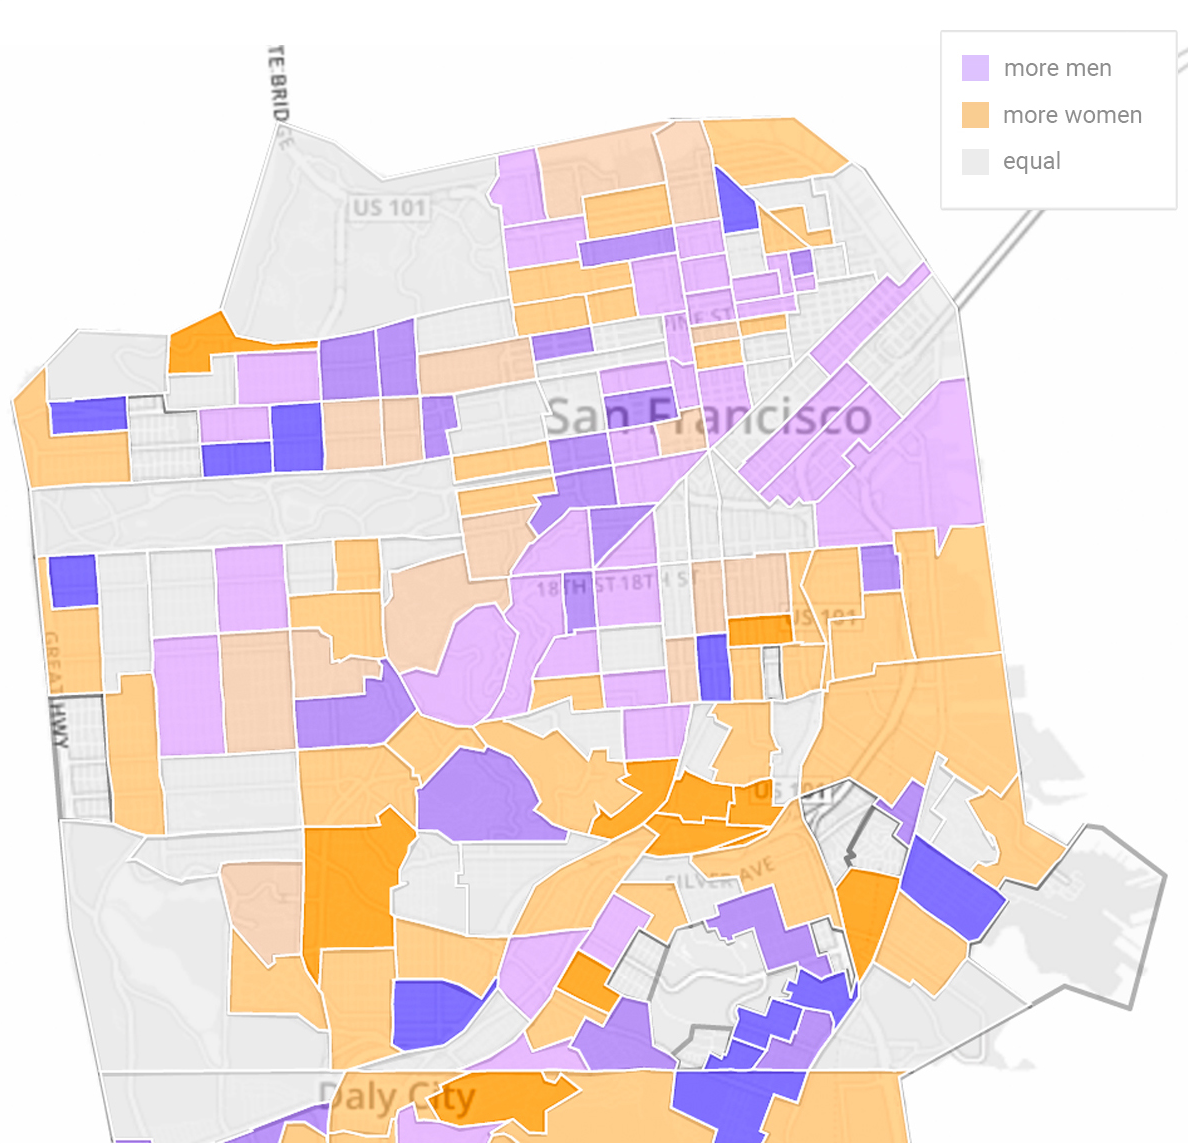
The front end query language made it especially easy to ask questions about hierarchical data, e.g. "From all trips labelled as recreational, count the number of distinct people of each sex who travel to each part of the city."