Figure 6
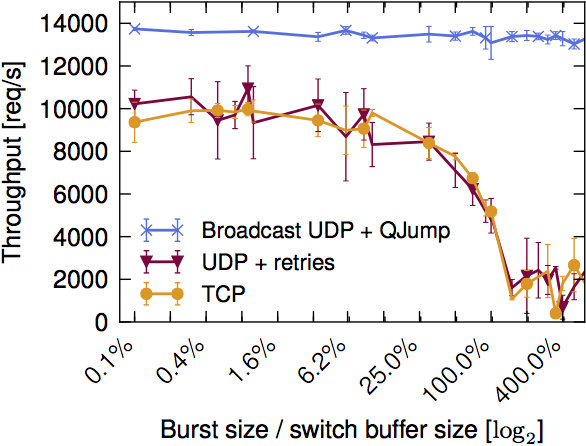
Figure 6 (Page 8) is used as an example of new functionality the QJump enables. For the figure, we build a simple 2-phase-commit system and demonstrate the decreasing performance that it achieves under high load. We then resolve this using QJump, use broadcast UDP to improve the performance.
Figure 6
Software Required
In addition to these general software requirements, we also used:
- QJump kernel module
- QJump application utility
- packet-gen as found in qjump-camio-tools
- q2pc as found in qjump-q2pc
Physical Configuration
The basic physical network configuration is described here. In this experiment the following configuration was used:
- packet-gen 1 (bursty) was run on Quorum 206 sending to netcat on Hammerthrow
- packet-gen 2 (constant) was run on Quorum 201 sending to netcat on Backstroke
- the Q2PC coordinator was run Nikola07
- the Q2PC servers were run on Quorum 208, Quorum 207, Raphael, Tigger, Uriel, Freestyle and Michael
Sofware Configuration
This is a complex experiment to run and coordinate. It requires:
- Traffic generator 1 generates a bursts of n x 1500B packets followed by a 25ms pause.
- Traffic generator 2 generates traffic at line rate traffic of continuous 1500B frames.
- Two tarffic sinks to supress ICMP undelivered notification messages
- One 2 Phase Commit coordinator to issue and and wait for 2PC messages
- Seven 2 Phase Commit servers to receive and respond to 2PC messages
- drive_q2pc_pl.sh - configures the paramters of each q2pc experiment. It iterates over experiment configurations running 3 trials for each configuration (UDP, TCP, UDP+retries, Broadcast UDP + QJump), for each packet burst length.
- run_2pc_pl.py - runs an individual experiment. It ssh's into each machine, killing, configuring, running and collecting results for each experiment.
./drive_q2pc_pl.sh
Raw Data
Our original unprocessed datasets can be found here (5.69GB)(>40GB uncompressed). For conveniance, we also include the processed version of the data here. The files come in pairs: each pair contains a file with the prefix "q2pc_stats" and a file with the prefix "README_". The q2pc_stats file contains the raw output from the Q2PC application. The README contains a complete log of the experiment as it ran. Each q2pc_stats file contains about 1,600,000 lines. Filenames are of the form [prefix]_[protocol]_[burst size]_[date]T[time]. Where [protocol] is rdp-ln, tcp-ln, udp-ln, or udp-qj. rdp-ln files have the form [prefix]_[protocol]_[rto]_[burst size]_[date]T[time] where rto is the rtransmit timout in microseconds. Each line has the following format:
| time_offset | Relative time since the start of the experiment in microseconds |
| thread_id | ID of the thread from which this record came |
| client_id | ID of the client from which this record came |
| c_rtos | client retransmit time outs |
| s_rtos | server retransmit time outs |
| time_start | time that the message was first sent in microseconds since 1 Jan 1970 |
| time_end | time that the response was received in microseconds since 1 Jan 1970 |
| time_msg | time that the message took to send and recieve in microseconds |
| type | type that the message was. -1 = msg lost, 0 = request , 1 = vote yes , 2 = vote no , 3 = commit , 4 = cancel, 5 = acknowlege, 6 = connect |
Processing and plotting the results
The processing and plotting scripts can be found here. It is run as follows:
./process_q2pc ../data/q2pc_data/q2pc_stats_*
The processing script outputs a file with the following format:
| protocol | rdp-ln, udp-ln, tcp-ln, udp-qj |
| burst | burst size in packets |
| GID | global identifier of the file (timestamp) |
| time elapsed | time in miliseconds that the experiment took |
| rate | in requests per second |
| min lat | minimum latency for a message in microseconds |
| med lat | medium latency for a message in microseconds |
| max lat | maximum latency for a message in microseconds |
For conveniance, we include the processed version of the data here. When running this experiment, we found that there were some problems with our packet generator. In some cases, the packet generator would fault half way thought the experiment. For plotting, we excluse these failed cases. Also, we only include the case of R-UDP configured for a Retransmit TimeOut (RTO) of 200ms (the same a the TCP default). The file can then be processed into plottable form with the following:
cat ~/r2d2/q2pc_stats.all | sort -k 2 -n | tr -s " " "," > ~/r2d2/q2pc_stats.all.csv
And can then be plotted as follows:
python plot_q2pc_noise_vs_throughput.py ~/r2d2/q2pc_stats.all.csv rdp-ln.200000 RUDP tcp-ln TCP udp-ln UDP udp-qj QJ