Figure 3
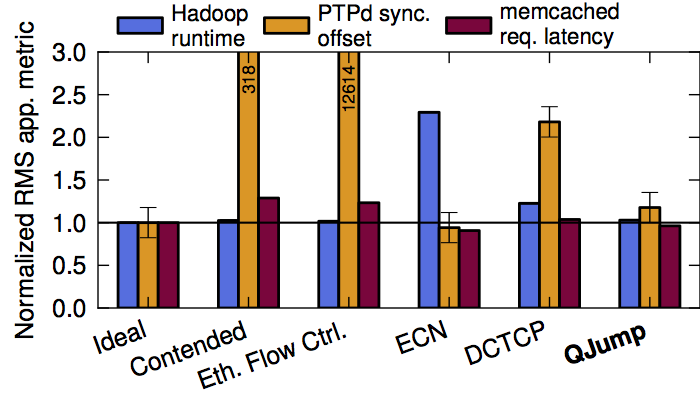
Figure 3 shows a comparision between QJump and a collection of other systems. It compares against an idle network case, a contended case, Ethernet Flow Control, Explicit Congestion Notifications, DCTCP and QJump and show that QJumnp is the closest to the ideal.
Figure 3
Software Required
In addition to these general software requirements, we also used:
- QJump kernel module
- QJump application utility
- Hadoop Map-Reduce 4.5.0 (installed from Cloudera packages, instructions here)
- Memcached 1.4.14 (installed from Ubuntu packages)
- memaslap from libmemcached 1.0.15 (patched as below)
- PTPd 2.1.0 as installed from the Ubuntu repository
Physical Configuration
The basic physical network configuration is described here. In this experiment the following configuration was used:
- When running, H3 ran the (patched) memaslap client and H11 ran the memcached server
- When running, H1 ran the PTPd client and H8 ran the PTPd master
- When running, The Hadoop Map-Reduce cluster ran on H4-H7, H9,H10 and H12
Patches
Memaslap
To obtain more detailed results from memaslap, we patched it to collect statistics in memory and dump them to standard output when complete. The patch file should be applied to the clients sub-directory of the libmemcached 1.0.15 source tree listed above. To build memaslap, run "./configure --enable-memaslap" followed by "make && sudo make install".
DCTCP
In experiments using DCTCP, we upgraded the DCTCP kernel patch to run on a Linux 3.4.55 kerene. The upgraded version of the DCTCP patch found here. We installed and configured DCTCP following the instructions found here.
Sofware Configuration
The full Hadoop Map-Reduce configuration can be found here. The PTPd client and server were configured as follows:
Server
e=1; p=0; ./qjau.py -p $${p} -c "ptpd -c -b eth6.2 -y 0 -D -h -T 10"
Client
e=0; p=7; ./qjau.py -p $${p} -c "ptpd -x -c -g -D -b eth0 -h -T 10 -f ../data/ptpdCFRS201_memcachedBS206_hadoop_R2D2P$${p}_PTPD_$${e}
Where "$$e" is th experiment number and "$$p" is the QJump prioirty level.
Memcached and memaslap were configued as follows:
Server
e=1; p=0; sudo ./qjau.py -p $${p} -c "/usr/bin/memcached -m 64 -p 11211 -u memcache"
Client
e=1; p=0; for {1..25}; do
./qjau.py -p $${p} -c "../clients/memaslap -s 10.10.0.3:11211 -S 1s -B -T2 -c 128 -X 1024" > ../data/ptpdCFRS201_memcachedBS206_hadoop_R2D2P$${p}_$$(printf "%02i" $${i})_MEMD_$${e};
done
Where "$$e" is th experiment number and "$$p" is the QJump prioirty level.
When QJump was enabled, it was configured as follows
bytesq=256 timeq=5 p0rate=1 p4rate=100 p7rate=9999999
Raw Data
PTPd Data
Our original PTPd unprocessed datasets can be found here (478kB). Inside the archive are file names of form:
- ptpdCFRS201_R2D2P0_PTPD_[0-1] - PTPD running alone of the network with the client on FS (Freestyle) and the server on 201 (Quorum 201).
- ptpdCFRS201_memcachedBS206_hadoop_R2D2P0_PTPD_[XXX] - PTPd running on the network, shared with memcached and Hadoop. Exact experimental configuration as per the table below.
2014-01-22 19:51:27:363605, slv, 90e2bafffe27fbc8/01, 0.000140635, -0.000019134, 0.000197000, 0.000108000, 21106
Where the first column is the timestamp, and the fifth coloum is the syncornization offset.
Memcached Data
Our original unprocessed memcached datasets can be found here. There are 47 archives of approx 1GB each (~5GB uncompressed). The file names are of the form:
- memcachedBS206_R2D2P0_MEMD_[0-3] - Memcached running alone of the network with the client on BS (Backstroke) and the server on 206 (Quorum 206).
- ptpdCFRS201_memcachedBS206_hadoop_R2D2P0_MEMD_[XXX] - As above, but with PTPd and Hadoop running. Exact experimental configuration as per the table below.
{GET | SET | TOTAL} , REQUEST ID, LATENCY
Hadoop Data
Our original unprocessed Hadoop datasets can be found here (881B). The file names are of the form:
- hadoop_baseline_[1-5] - Hadoop running alone of the network.
- ptpdCFRS201_memcachedBS206_hadoop_R2D2P0_hadoop_[XXX] - Hadoop running on a shared network with memcached and PTPd. Exact experimental configuration as per the table below.
TOTAL_TIME: 126
Where time is a value in seconds that each join took.
Experimental Configurations
| Exp. No. | Description |
|---|---|
| 0-2 | Memcached baseline - no contention |
| 0 -1 | PTPd baseline - no contention |
| 1-5 | Hadoop baseline - no contention |
| 101-105 | Contended, no mitigation |
| 106-110 | Contended, using QJump |
| 111-115 | Contended, using Ethernet Flow Control |
| 116 | Contended, using Explicit Congestion Notifications, configured with min = 5 segements, max = 10 segments |
| 117 | Contended, using Explicit Congestion Notifications, configured with min = 10 segements, max = 20 segments |
| 118 | Contended, using Explicit Congestion Notifications, configured with min = 20 segements, max = 40 segments |
| 119 | Contended, using Explicit Congestion Notifications, configured with min = 40 segements, max = 80 segments |
| 120 | Contended, using Explicit Congestion Notifications, configured with min = 80 segements, max = 160 segments |
| 122 | Contended, using Explicit Congestion Notifications, configured with min = 160 segements, max = 320 segments |
| 123 | Contended, using Explicit Congestion Notifications, configured with min = 320 segements, max = 640 segments |
| 124 | Contended, using Explicit Congestion Notifications, configured with min = 640 segements, max = 1280 segments |
| 125 | Contended, using Explicit Congestion Notifications, configured with min = 1280 segements, max = 2560 segments |
| 126 | Contended, using Explicit Congestion Notifications, configured with min = 2560 segements, max = 5120 segments |
| 127-131 | Contended, using DCTCP |
Processing and plotting the results
In the figure we use the Root Mean Squared (RMS) value of each application specific metric. We do this to to make easy comparisons of the magnitude of variance of the these time varying qunatities. Scripts to process the data and produce RMS outputs can be found here. All of the PTPd and Hadoop data can be processed at once by running;
process_ptpd_rms.py ../data/ptpd_data/* > ptpd.rms
process_hadoop_rms.py ../data/hadoop_data/* > hadoop.rms
Memcached files are large and need to be done one archive at a time:
tar -xvf ptpdCFRS201_memcachedBS206_hadoop_R2D2P0_MEMD_104.tar.bz2
process_memd_rms.py TOTAL ptpdCFRS201_memcachedBS206_hadoop_R2D2P0_MEMD_104
The results from the processing scripts above should look something like this:
5.314597 438 17 ../data/ptp_data/ptpdCFRS201_memcachedBS206_hadoop_R2D2P0_PTPD_119
Where 5.314... is the RMS value, 438 is the number of data points, 17 is the number lines skipped and ../data/ptp_data/ptpd... is the name of the source of the data.
To speed up processing, we provide the process_rms_out.py to summarise the above values by taking averages of multiple measurements.
./process_rms_out.py ptpd.rms
001 Alone 5.636801 (2)
002 Contended 1792.462081 (5)
003 Qjump 6.640541 (5)
004 Eth Flow. Cnt 71144.949588 (5)
005 DCTCP 12.296890 (4)
116 ECN-5:10 0.000000 (0)
117 ECN-10:20 4.605076 (1)
118 ECN-20:40 0.000000 (0)
119 ECN-40:80 5.314597 (1)
120 ECN-80:160 5.165254 (1)
122 ECN-160:320 9.894793 (1)
123 ECN-320:640 24.357411 (1)
124 ECN-640:12800 80.392287 (1)
125 ECN-1280:2560 99.046768 (1)
126 ECN-2560:5120 155.500869 (1)
These results where then manually compiled into a csv file like the one that can be foud here. Then, to produce Figure 7, run something like the following:
python plot_pf_ecn_dctcp_barchart-all.py ../data/bars-rms.csv \
Alone Ideal \
Hadoop "Contended" \
PauseFrames "Eth. Flow Ctrl." \
ECN "ECN" \
DCTCP "DCTCP" \
QJump "\\textbf{\textsc{QJump}}" out.pdf \
figure3.pdf