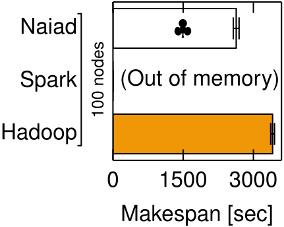
Figure 15b
Figure 15b
Under construction: we will add information on the experimental setup and our data sets here shortly.
If you are interested in being notified when the data appears,
please join our
musketeer-announce mailing list.
Thanks for your patience.
-- The Musketeer team.
Experimental setup
This experiment was executed on an Amazon EC2 cluster comprising of 100 instances. Please check the clusters page for more details.
Result data set
The raw results for this experiment are available here.
To plot Figure 15b, run the following command:
experiments/plotting_scripts$ python plot_kmeans.py /local/scratch/icg27/Dropbox/phd/Musketeer/experiments/kmeans/ec2/cluster3/stat/kmeans_10000kpoints_100clusters_hadoop_musketeer_ Hadoop /local/scratch/icg27/Dropbox/phd/Musketeer/experiments/plotting_scripts/spark_empty/kmeans_10000kpoints_100clusters_spark_ Spark /local/scratch/icg27/Dropbox/phd/Musketeer/experiments/kmeans/ec2/cluster3/stat/kmeans_10000kpoints_100clusters_naiad_baseline_ Naiad
The graph will be in kmeans.pdf